Has Rising House-Buying Power Accelerated House Price Appreciation?
Written by Mark Fleming, First American Chief Economist
Two of the three key drivers of the Real House Price Index (RHPI), household income and mortgage rates, modestly swung in favor of increased affordability in September, yet affordability declined month over month. The 30-year, fixed-rate mortgage fell by 0.01 percentage points and household income increased 0.03 percent compared with August 2019. When household income rises, consumer house-buying power increases. Declining mortgage rates have a similar impact on consumer house-buying power.
“Affordability trends are influenced by shifts in house-buying power and nominal home price appreciation. A shift in one or the other is not sufficient to know whether affordability has increased or decreased."
However, nominal house price appreciation jumped 1.1 percent in September, outpacing the benefits of rising house-buying power on affordability. Accordingly, the RHPI increased 0.9 percent month over month. Increases in the RHPI indicate a decline in affordability, and September’s decline in affordability was the largest month-over-month affordability decline since November 2018. In 2019, declining mortgage rates have increased house-buying power, fueling greater demand. However, when demand increases for a scarce (limited or low supply) good, prices will rise faster. While year-over-year, the RHPI shows an improvement in affordability, the increase in house-buying power in September was not enough to offset nominal house price gains compared with August.
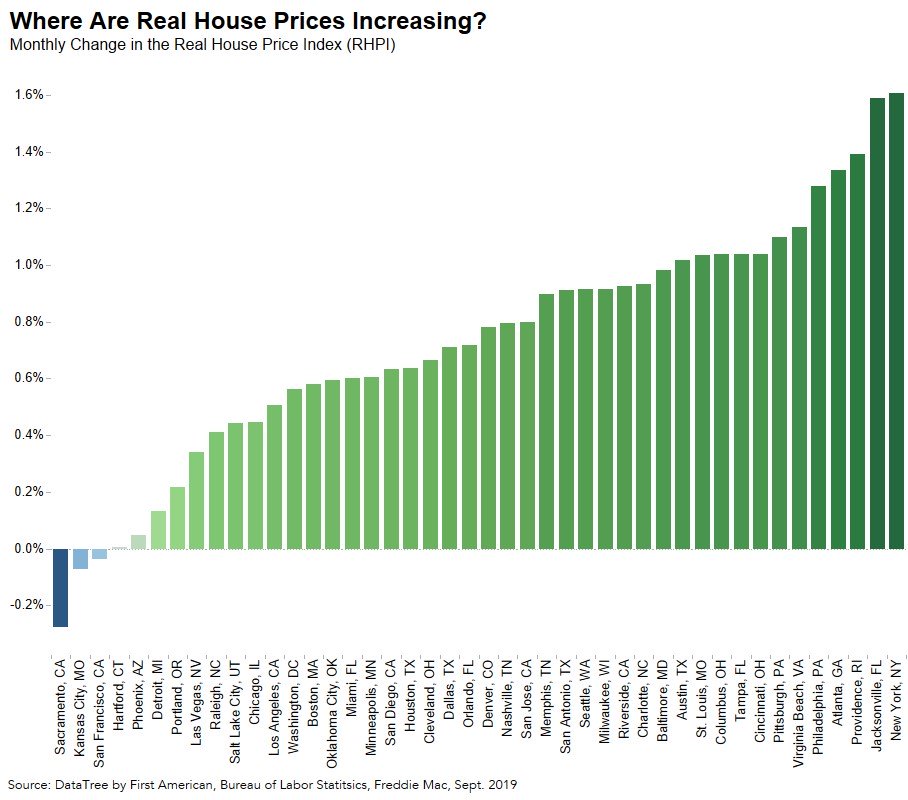
The Five Cities Where Affordability Decreased the Most
As the old adage goes, real estate is all about “location, location, location.” Of the 44 markets we track, the RHPI increased in 41 of them month over month, meaning affordability declined in each. The rise in the RHPI is a break from the long-term trend in 2019, as all of these markets are significantly more affordable than they were one year ago. Nevertheless, the five markets with the greatest month-over-month increases in the RHPI and thus the greatest declines in affordability were:
|
|
|
||
|
City |
House-Buying Power |
Nominal House Price Index |
RHPI |
|
1.) New York, NY |
-0.31% |
1.29% |
1.61% |
|
2.) Jacksonville, FL |
-0.45% |
1.59% |
1.59% |
|
3.) Providence, RI |
0.84% |
2.24% |
1.39% |
|
4.) Atlanta, GA |
0.16% |
1.50% |
1.34% |
|
5.) Philadelphia, PA |
0.69% |
1.98% |
1.28% |
Affordability declined the most month-over-month in New York City, where the RHPI increased by 1.61 percent. Nominal house prices increased by 1.29 percent, and house-buying power declined by 0.31 percent. Notice that nominal house price appreciation in New York City was less than in some other cities, but the combination with the decline in house-buying power led New York City to top the list in the loss of affordability. Nominal house price appreciation grew fastest in Providence, yet the city was third on the list for monthly increase in RHPI and thus decreased affordability. The month-over-month increase in house-buying power in Providence helped mitigate the negative impact from faster house price appreciation on affordability.
One month does not make a trend, yet these markets demonstrate the dynamic we expected to see – the consistent growth in house-buying power over 2019 has boosted demand in a supply constrained market, putting upward pressure on house price appreciation. Faster nominal house price appreciation can erode, or even completely eliminate, the boost in affordability from increasing house-buying power. Affordability trends are influenced by shifts in house-buying power and nominal home price appreciation. A shift in one or the other is not sufficient to know whether affordability has increased or decreased. The question for 2020 is, where does house-buying power go from here?
For more analysis of affordability, please visit the Real House Price Index. The RHPI is updated monthly with new data. Look for the next edition of the RHPI the week of December 30, 2019.